


The Mexican Peso (MXN) is flexing its muscle against the US Dollar in a week marked by contrasting economic signals. While US inflation continues to simmer, with the core PCE Price Index exceeding expectations, Mexico’s unemployment rate has dipped to surprising lows. This mixed economic picture presents a fascinating backdrop for the Peso’s recent gains. Let’s delve deeper and explore the forces driving this currency movement.
In a surprising turn of events, the Mexican Peso staged a comeback against the US Dollar on Friday. This resilience came despite mixed economic signals: US inflation ticked slightly higher, with the core Personal Consumption Expenditure Price Index (PCE) exceeding expectations in March. However, Mexico’s trade balance dipped into a deficit during the same month. The USD/MXN currency pair fell 0.42% to 17.13.
The Mexican Peso surprised markets with a counterattack against the US Dollar on Friday. This resilience came despite a mixed bag of economic news. In the US, inflation remained stubbornly high, with the core PCE exceeding expectations. However, Mexico’s trade deficit in March, revealed by the National Statistics Agency (INEGI), seemed to be overshadowed by a surprisingly low unemployment rate for the same period. Adding fuel to the Peso’s fire, positive sentiment across major Wall Street indices, with gains between 1.1% and 2.2%, further bolstered the Mexican currency. Let’s dissect these factors and see how they fueled the Peso’s recent surge.
Technical Analysis of the Mexican Peso: Bullish Momentum Pauses After Reaching Resistance
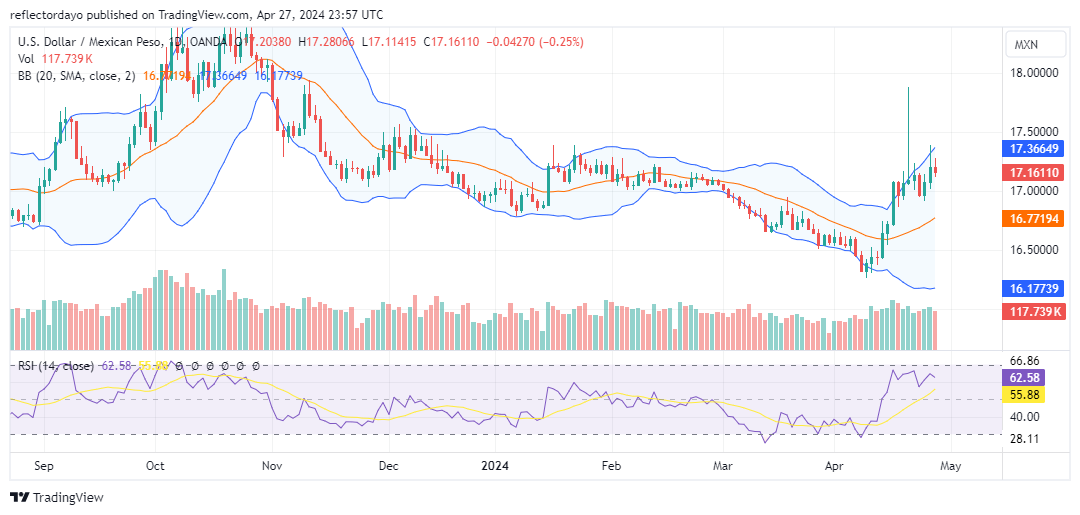
The USD/MXN pair experienced a significant surge on Friday, April 19th (last week), approaching the $18.00 level. This move could be interpreted as a sign of weakening bullish momentum. On Thursday, April 25th, the pair attempted another rally but stalled around $17.40, potentially reflecting growing bearish sentiment.
An analysis of the Bollinger Bands indicator reveals that the upper band is wider than the lower band, indicating a period of increased volatility. However, the greater divergence of the upper band suggests the bull market might still be in control. The current price pullback could simply be a correction from an overbought condition rather than a definitive reversal of the trend.
Get free access to our lifetime VIP membership. Join us here.


Leave a Reply