


With lots of economic data on the way from the United States, traders are becoming more conservative as they await these market-influencing fundamentals from the dollar side. This, however, is having a limiting effect on most of the major FX pairs. Nevertheless, let’s examine these pairs more closely.
EURUSD: Bearish
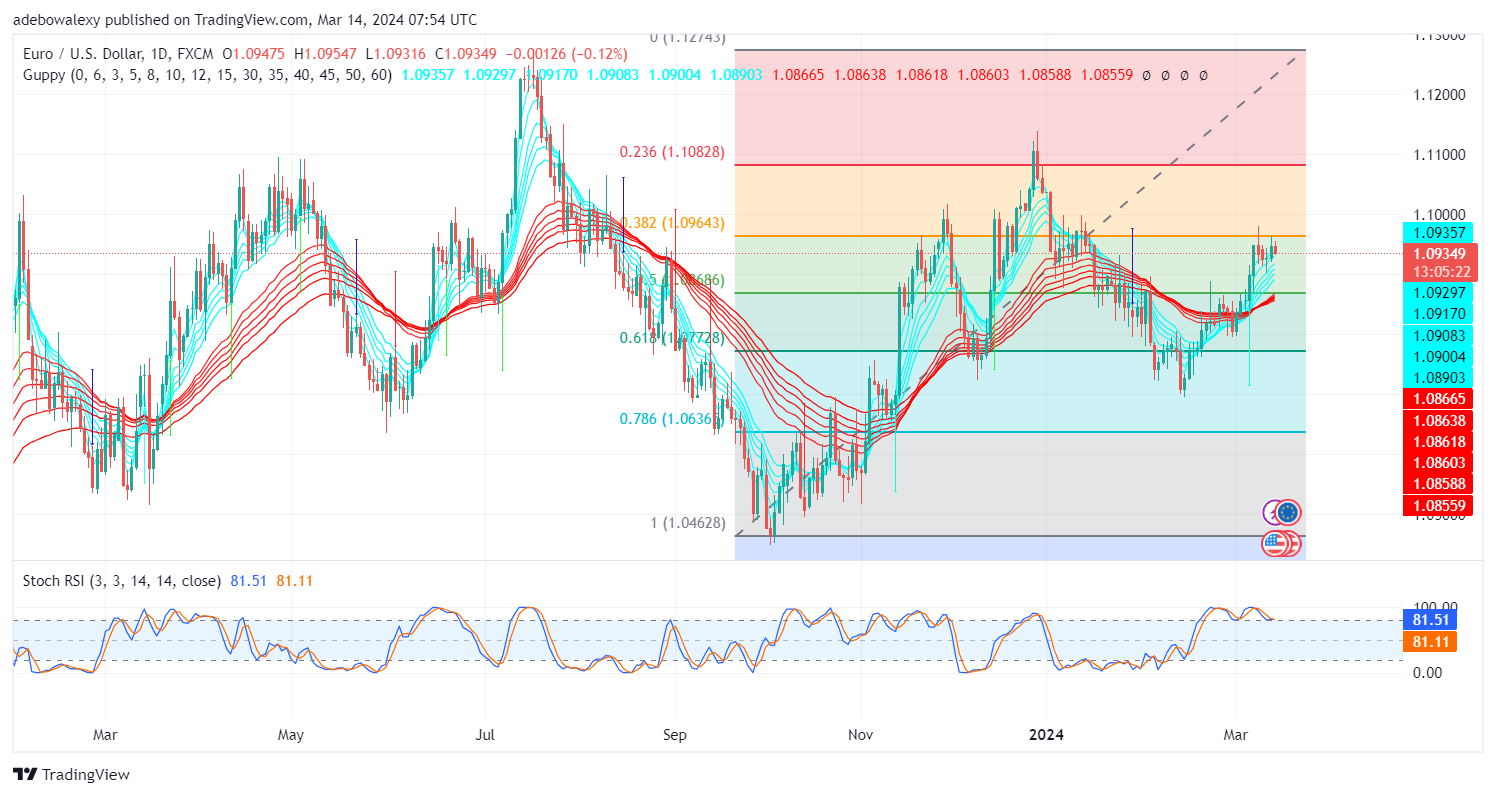
The EURUSD has an upward trajectory, yet when the market is considered over an extended period of trading sessions, price action bounced off the psychological support level at 1.0700. The ongoing sessions have only introduced minor shifts in the upside path. Furthermore, the current price of the pair remains above most of the Guppy Multiple Moving Average (GMMA) lines.
Furthermore, the Relative Strength Index (RSI) lines have converged for a bullish crossover in the overbought region. Consequently, this should result in price action continuing its upside retracement towards the 1.100 mark. However, emerging fundamentals from the US will play a key role in determining this.
GBPUSD: Bullish
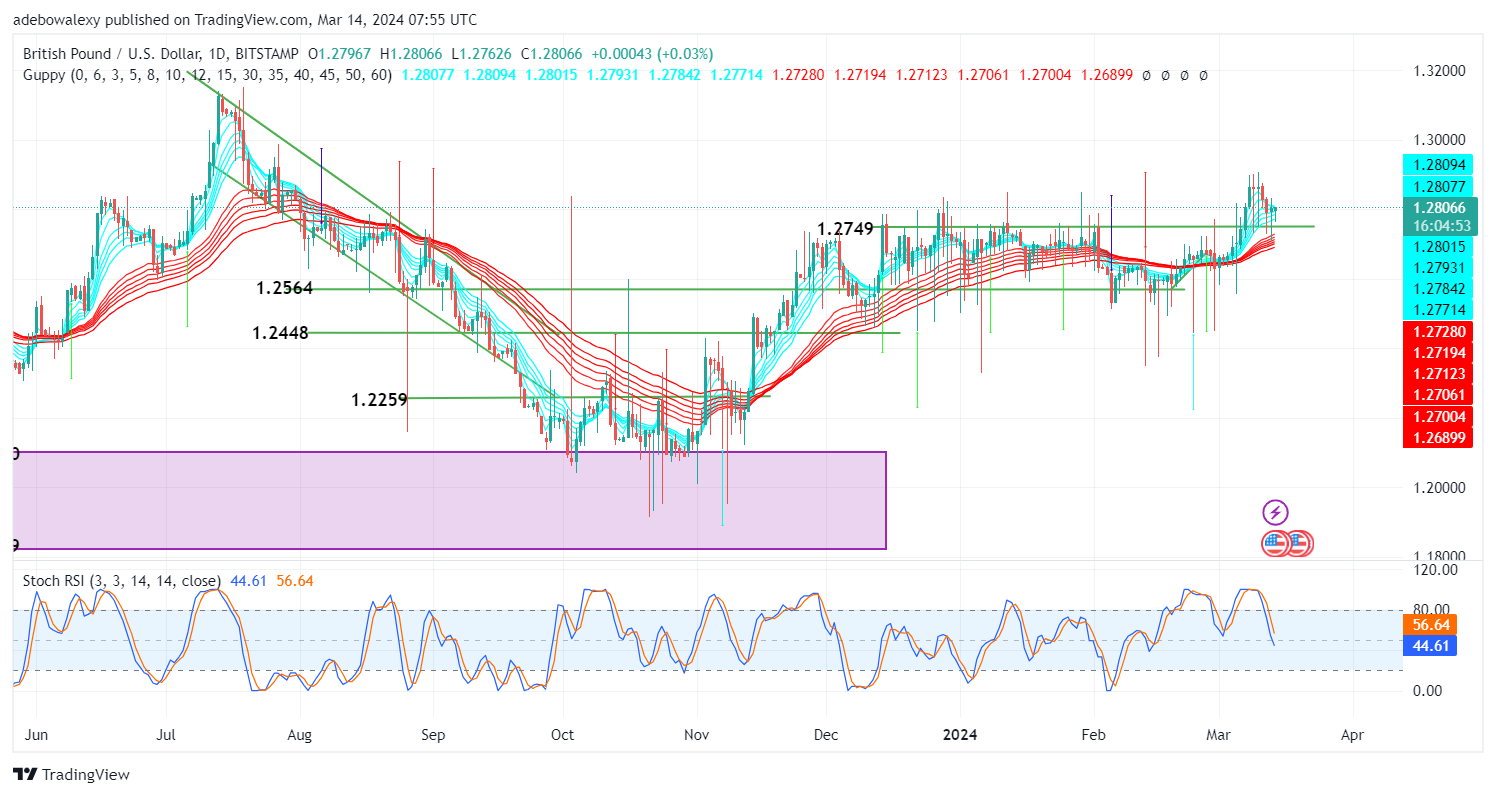
GBPUSD remains above the recently obtained support level at the 1.2750 mark. In fact, buyers seem to be seriously defending this support for this major FX pair. The previous session was bullish, indicating a change in the moderate downward correction path. However, what seems strange is that the ongoing session hasn’t really advanced upward from where the previous session brought the market.
However, the GBP appears strong as the market seems prepared to take off towards higher marks. While the RSI lines look depressed and keep running towards lower levels, the last price candle kept the price of this major FX pair above the 1.2800 mark. Traders can expect prices to take off towards 1.2850 in the meantime. Nevertheless, USD still is a great determinant in this market.
USDCHF: Bullish
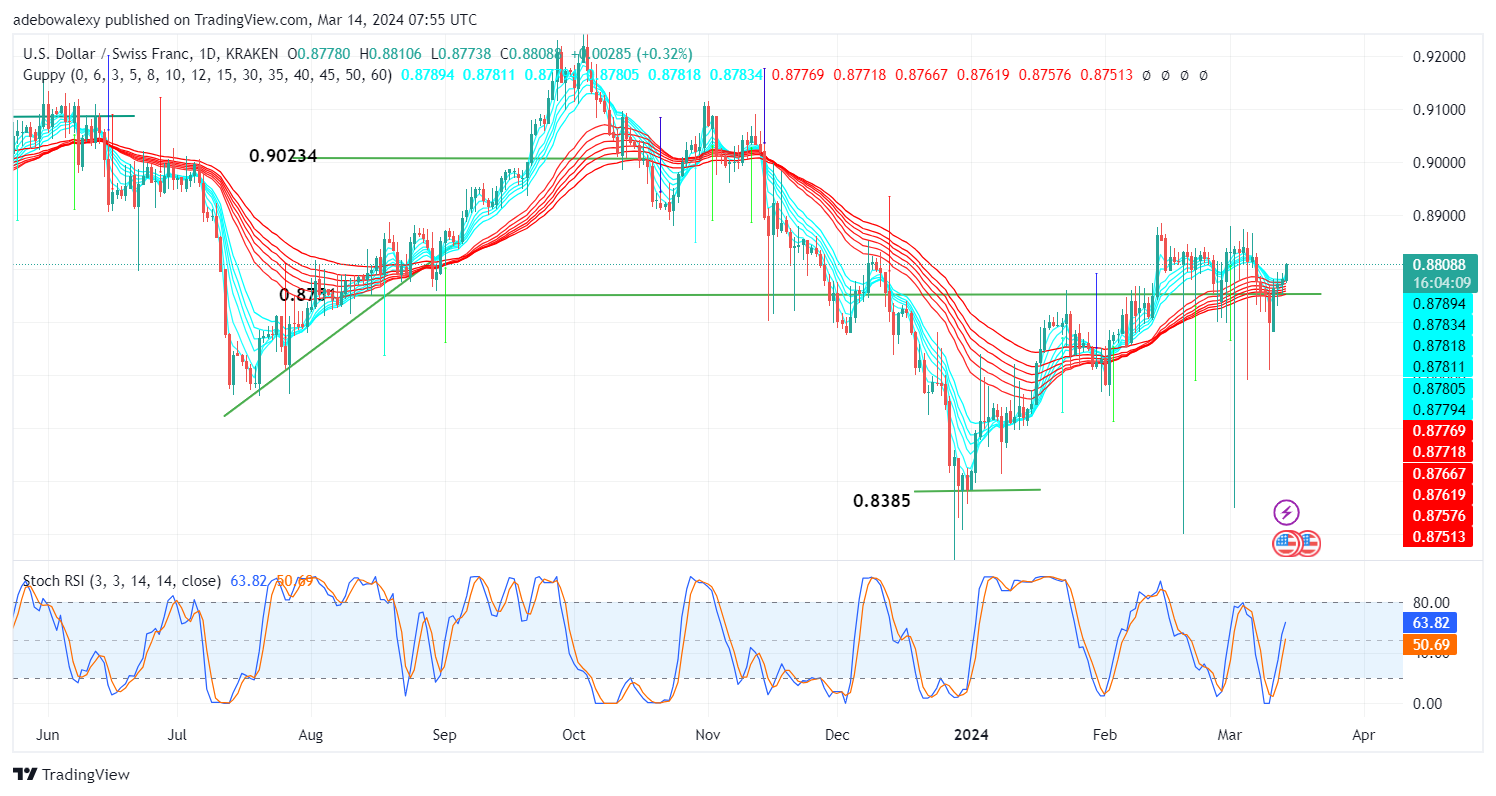
Despite the flatness of the US dollar, USDCHF has gathered some momentum going by the last price candle on this daily chart. The last price candle here has pushed the market further upwards after price action crossed the 0.8750 threshold. At this point, this major FX pair seems primed for more significant price increases should the awaited fundamentals arrive positively for the dollar.
This assurance stems from the fact that price action has just risen past the crossed GMMA indicator lines. Also, the RSI lines continue trending upwards as they delivered a bullish crossover in the oversold region. However, the RSI indicator lines seem a bit too reactive considering the magnitude of gains seen since the previous crossover. This may signal that the market may be choppy. So, traders anticipating a continued correction towards the 0.8850 mark should exercise caution.
USDCAD: Bearish
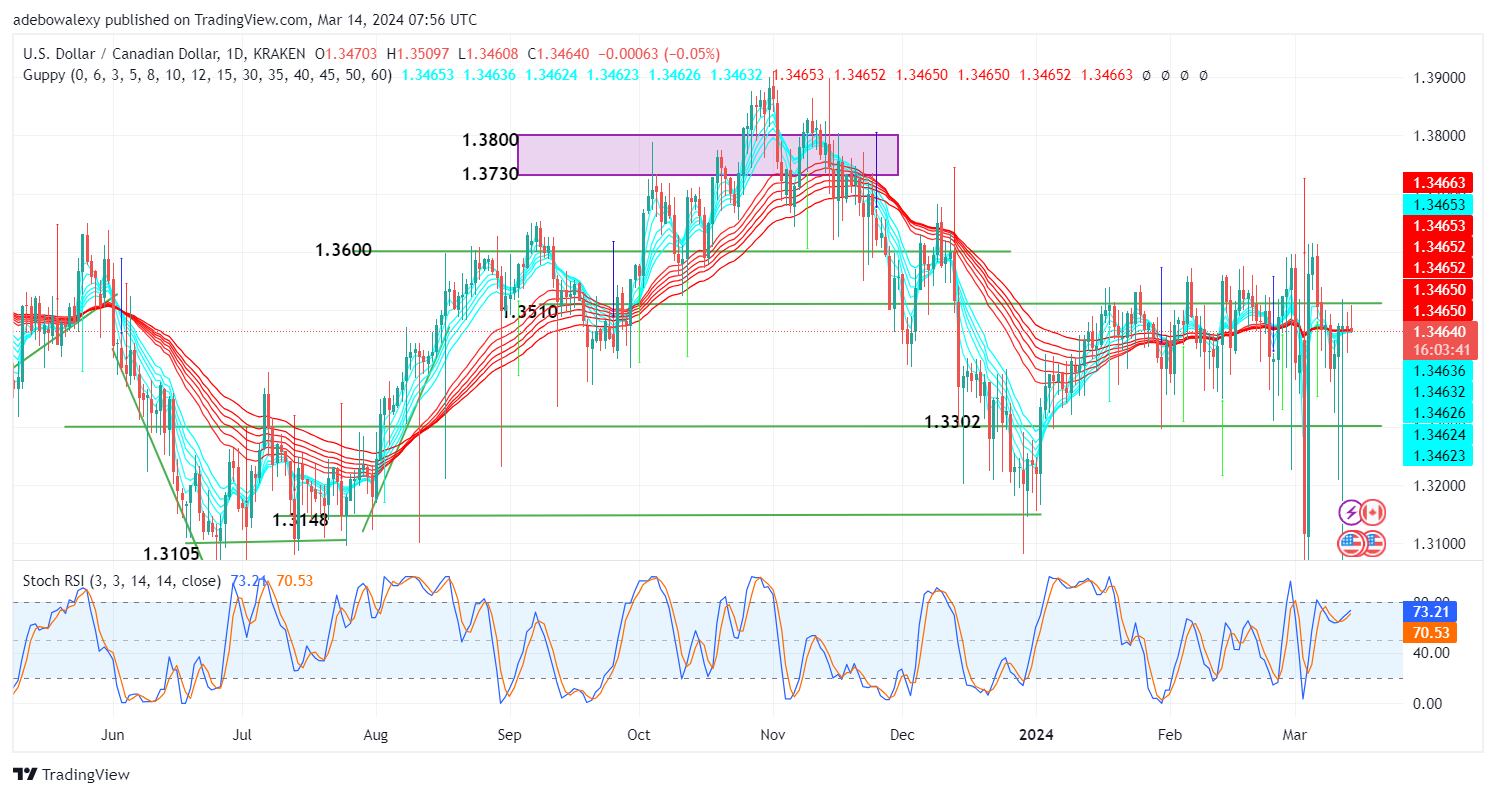
The USDCAD maintains flatness considering the behavior of price action in this market. Mostly due to the anticipation in the market, this major FX pair hasn’t been able to encounter any reasonable moves. Nevertheless, one can notice that there have been some notable contractions in the market.
The current price of the pair is now between the GMMA lines. Also, the RSI lines are still rising into the overbought region. This shows that upside momentum is active and seems to be pushing back at headwinds. Combining this with any positive fundamental from the United States, this pair may attempt to break the resistance at the 1.3510 mark.
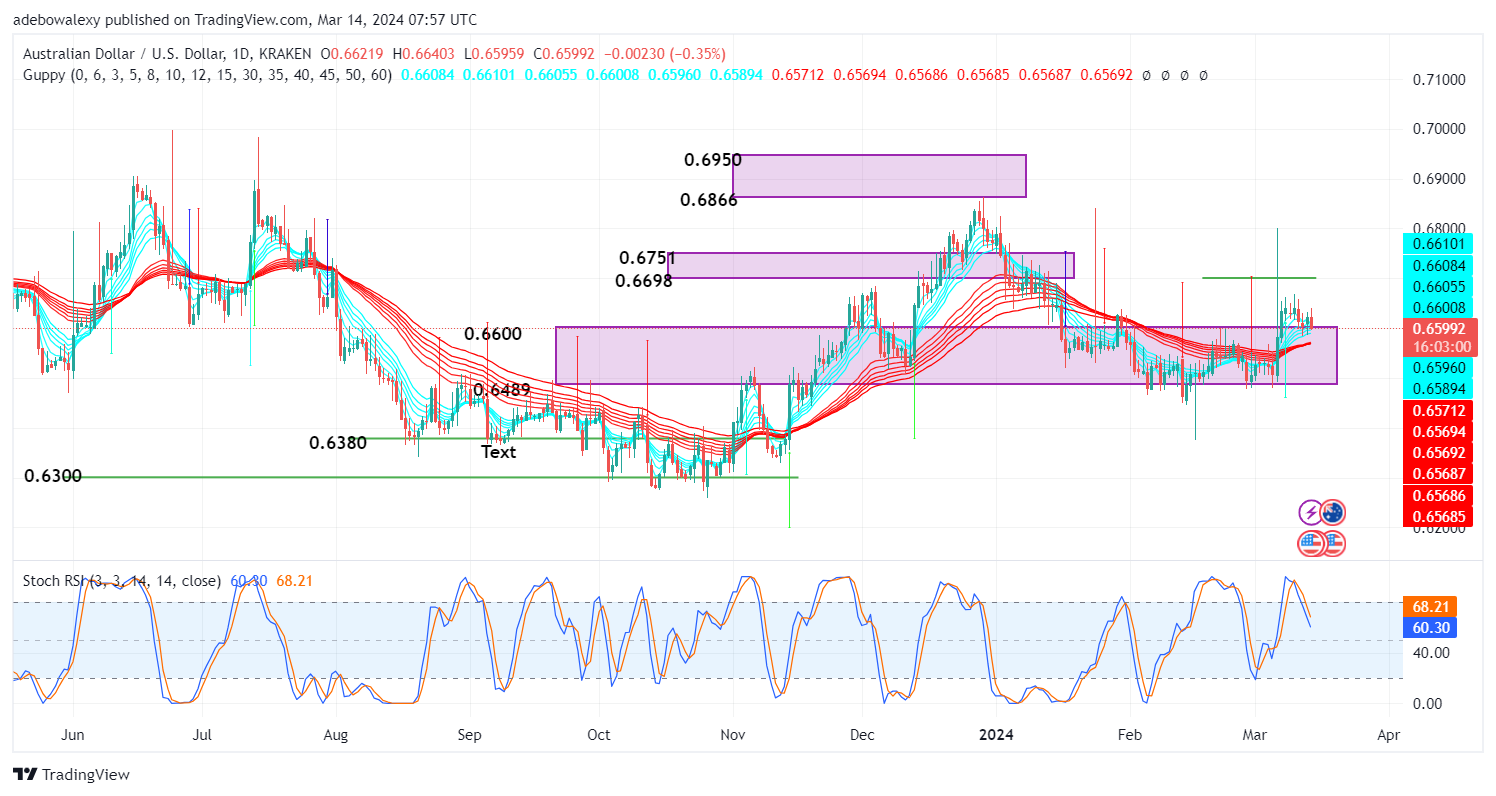
AUDUSD: Bearish
Despite the USD flatness, the AUDUSD pair is still not making any bullish progress. This seems most likely due to the fact that when the US dollar appears, it is still stronger than that of the Australian dollar. This is displayed through the last price candle on this chart. The mentioned price candle has plunged the market below the 0.6600 mark.
Also, this seems to be below most of the green GMMA lines. The RSI lines have continued to trend downwards at the same time, although it seems a bit exaggerated or hyperactive. Nevertheless, the market may fall lower should market expectations for the US dollar favor the bears. This will bring the major pair towards 0.6500 support.
EURJPY: Bearish
The EURJPY market experienced some rejections after its price action crossed above the GMMA lines. As a result, this brought the market back below two of the crossed GMMA lines. Nevertheless, upside forces are still a bit more favored on the technical front. While price action remains above most of the GMMA lines, the RSI lines continue to trend upwards, however, in a bit of a hyperactive manner.
Consequently, this points out that price action will likely resume its upside correction very soon. However, this may be impeded if the Eurozone shows signs of weakness on a fundamental basis. In the meantime, traders can still target the resistance at the 162.50 mark.
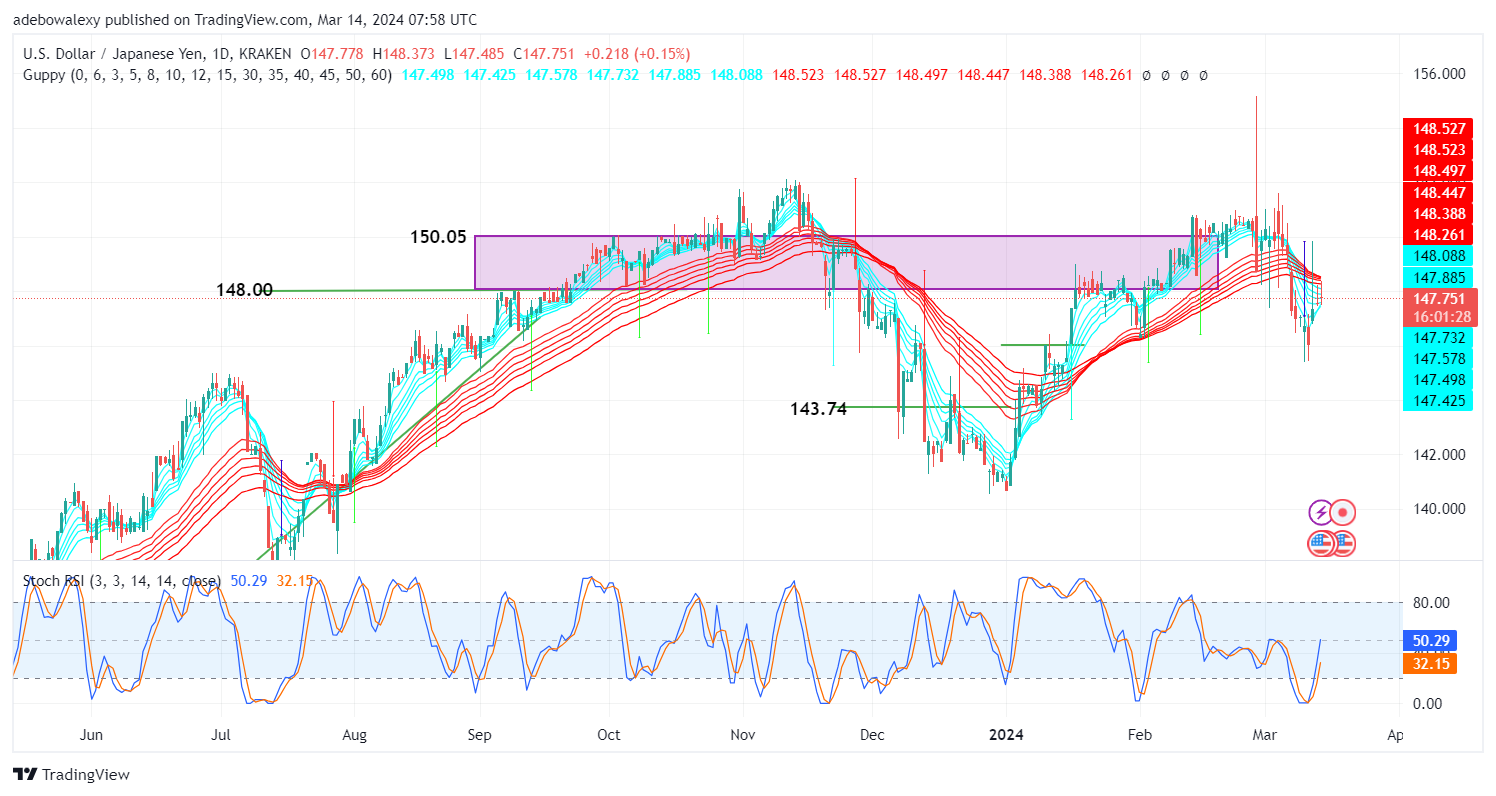
USDJPY: Bullish
The USDJPY seems quite choppy, considering price behavior in recent trading sessions. The market seems to have taken an interesting turn when it hit support around the 146.00 mark. Ever since, the market has kept an upward trajectory despite the activities of headwinds. At this point, the market has risen significantly above most of the GMMA lines.
However, it could be perceived that market forces are in a face-off, considering the appearance of the last price candle here. Nevertheless, it could be seen that the market has continued on its path despite these. Kindling the hope of bulls in this market are the RSI indicator lines, as it keeps rising further upwards despite the appearance of the last price candle on this chart. Therefore, traders can hope that the market may continue towards the 149.00 resistance mark.
Get free access to our lifetime VIP membership. Join us here.


Leave a Reply