


The US dollar has grown weak, and this can be attributed to the dovish stance of the Fed concerning the rate decision. Consequently, this has influenced most of the major FX pairs in a way that seems quite interesting. Let’s gather more insight into each of them by examining them more closely.
EURUSD: Bullish
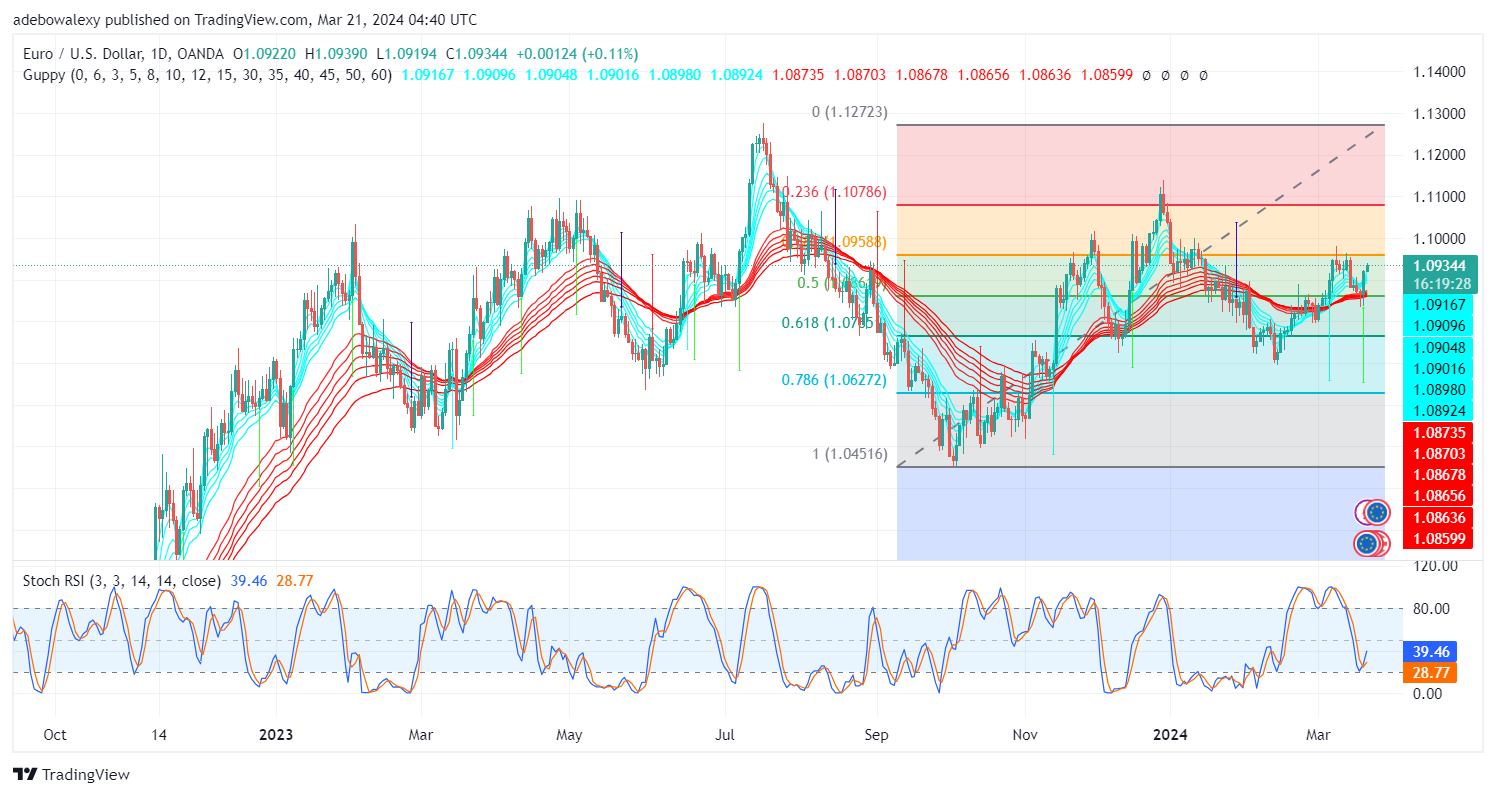
The EURUSD is one of the major FX pairs that has benefited positively from the weakened US dollar. The previous session in this market had bounced off the support level at the 50 level of the Fibonacci Retracement tool. Also, the ongoing session has continued on the same path, validating Fibonacci Retracement Level 50. In addition, price activity has, as a result, continued to appear above the Guppy Multiple Moving Average (GMMA) lines.
Furthermore, the Stochastic Relative Strength Index (SRSI) indicator lines have continued trending upward from the oversold region. Combining the ensuing signs from trading indicators with the moderate appearance, it could be concluded that this market may continue toward the 1.1000 mark.
GBPUSD: Bullish
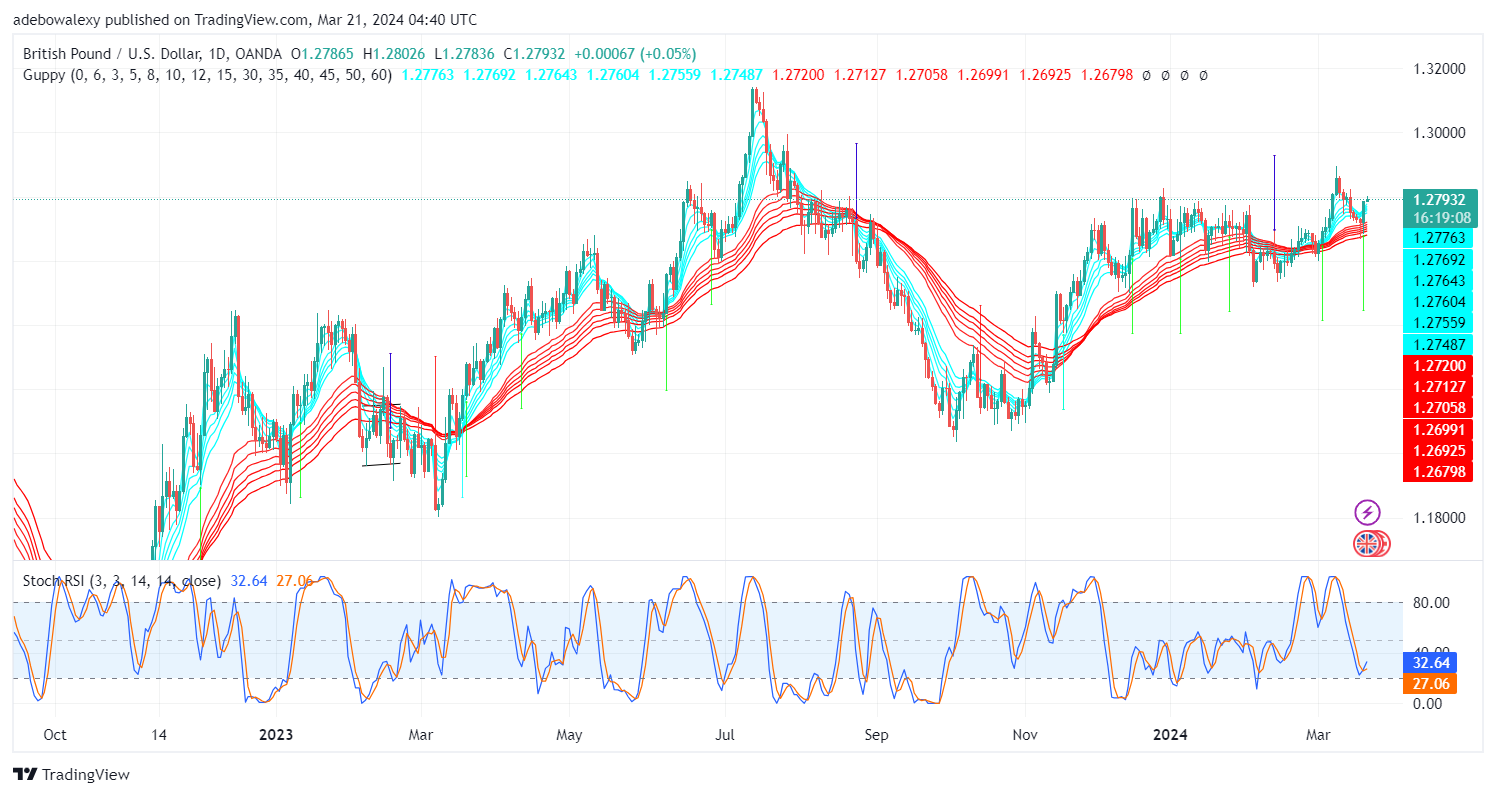
The GBPUSD also stands among the major FX pairs that are benefiting from the current mood of the USD. However, the recorded gains so far seem quite minimal, but they have the chance to keep growing steadily in the meantime. However, the recorded gains in today’s session have placed the pair above the GMMA lines.
This has positioned the pair for more gains. The crossover in the SRSI indicator lines attests to the possibility of continued price increases. This could be seen through the displayed crossover in the oversold region. Consequently, traders can hope to ride the trend towards the 1.2830 mark pending any negative fundamentals from either side of the market.
USDCHF: Bearish
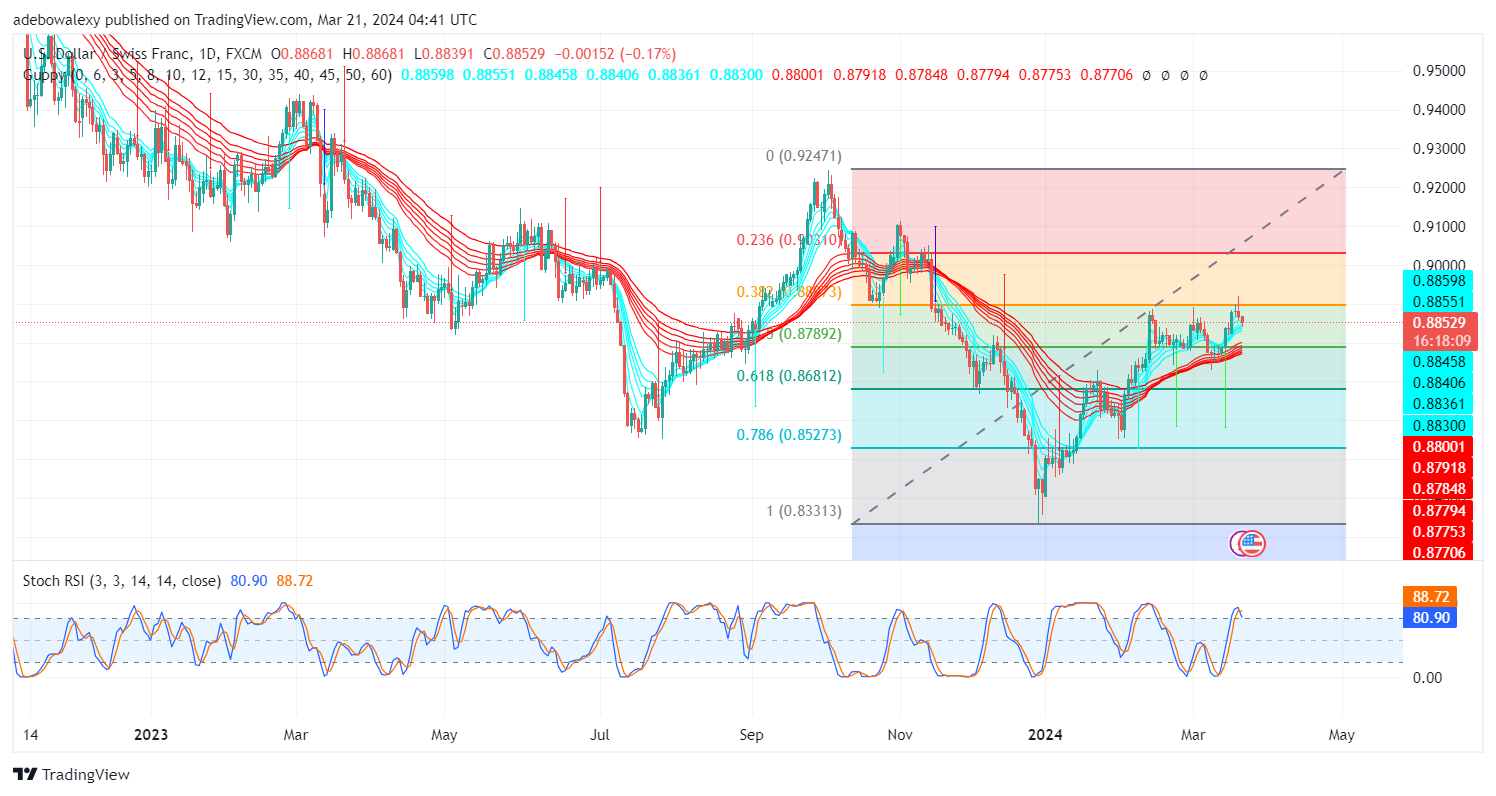
USDCHF has taken a bearish trajectory since the previous session as soon as price action attempted to break the resistance at the 0.8897 mark. The ongoing session has also continued the trend in line with the prevalent sentiment surrounding the US dollar. However, the price candle representing the ongoing session stands above most of the GMMA curves.
But contrary to the safety of standing above most of the GMMA, the SRSI indicator lines have given a bearish crossover in the overbought region of the indicator. Technically, this signals that the downward correction may intensify toward the 0.8790 mark.
USDCAD: Bearish
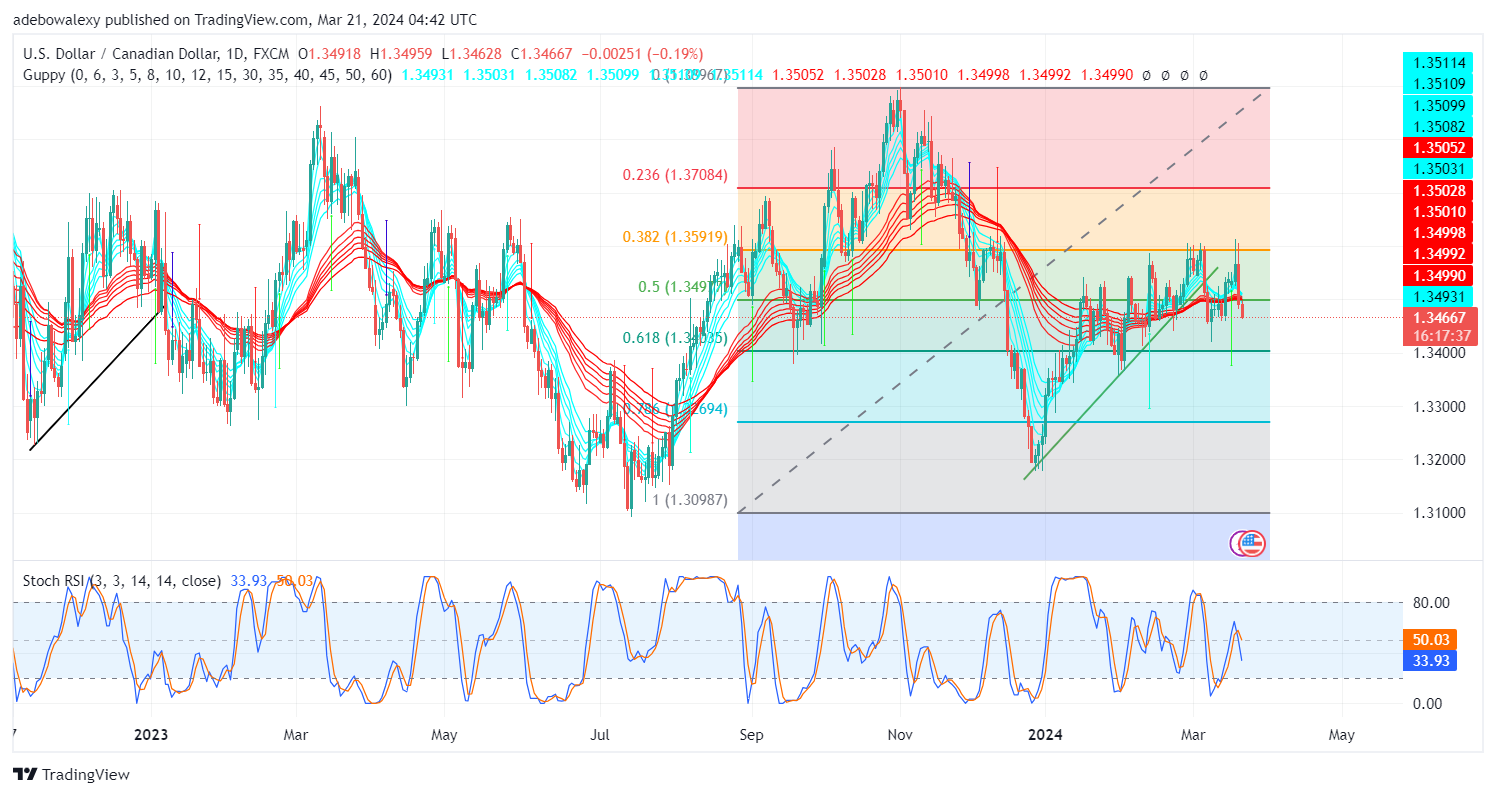
The USDCAD seems to be the most affected major FX pair, considering how steeply its price has fallen. It appears that the Canadian dollar has grown stronger while the US dollar has been bearish. This has combined to create strong downward momentum for the pair.
The ongoing session has continued on the strong bearish path that was taken in the previous session. In this market, price action has fallen below the GMMA lines. Additionally, the SRSI indicator lines have continued to trend downward following a crossover above the 50 mark of the indicator. From this, traders can brace for more price declines toward the 1.3400 mark.
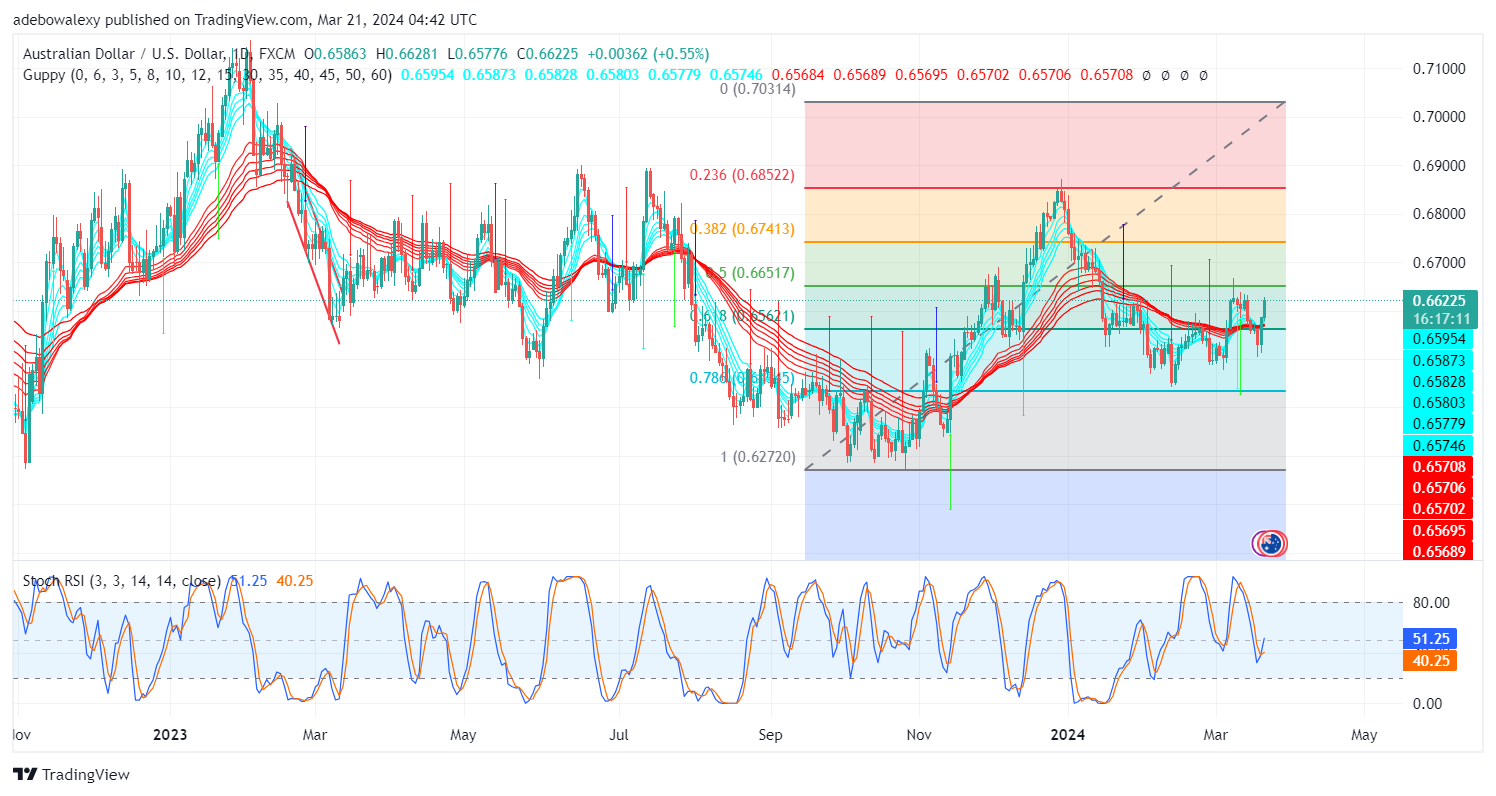
AUDUSD: Bullish
The AUDUSD market has rebounded strongly since the previous session. Today, price action has maintained almost the same amount of intensity towards higher price levels. At this point, price action now eyes the 50 level of the Fibonacci Retracement tool.
Price action has risen past the GMMA lines with good vigor. Additionally, the SRSI indicator lines have delivered a bullish crossover, thereby suggesting that the market may continue upwards, at least toward the 0.6652 mark.
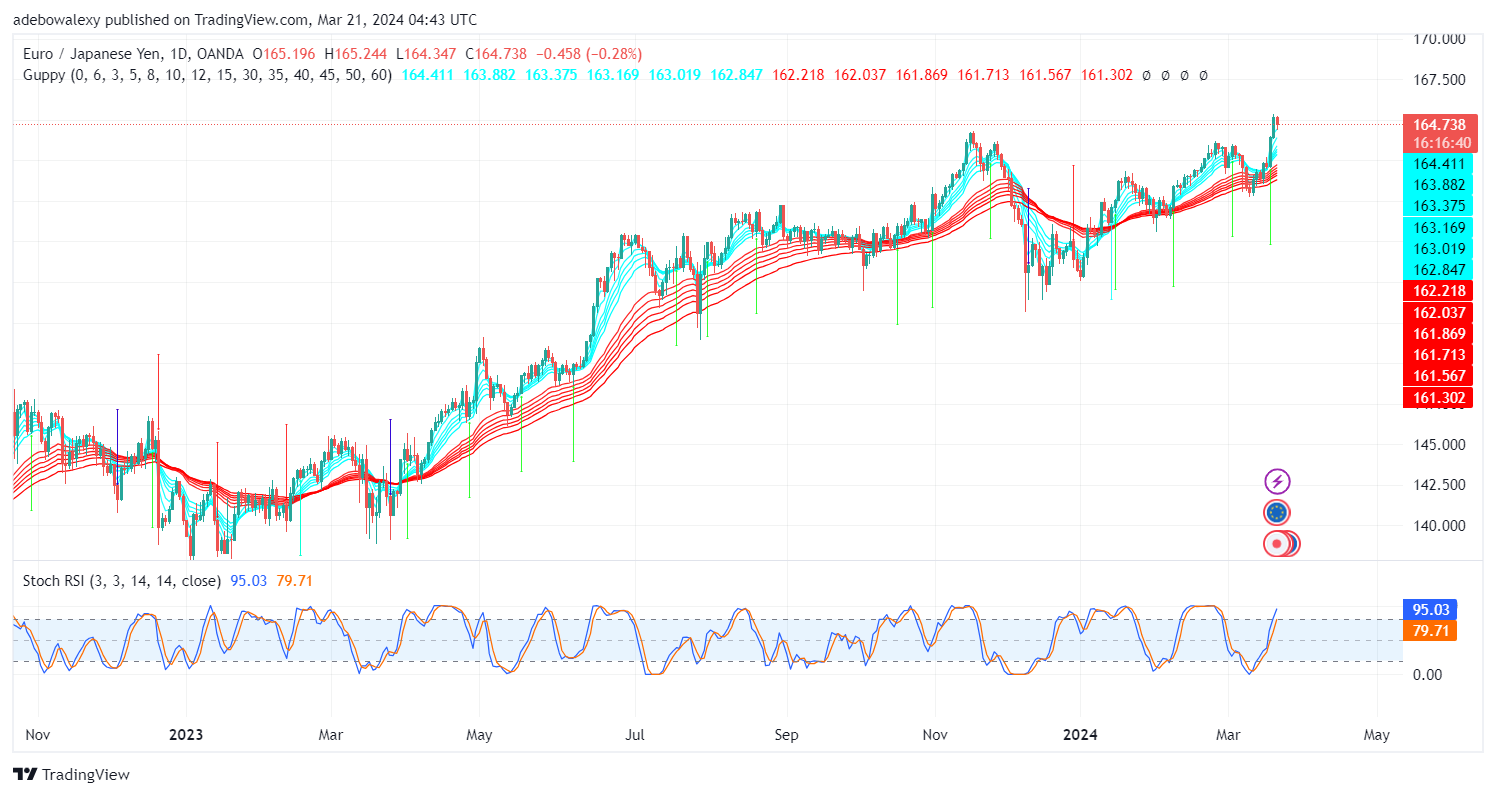
EURJPY: Bearish
The EURJPY market has risen through the price resistance level at the 164.00 mark. However, the ongoing session has deflected a bit downward. Yet price action maintains a fair upside trajectory, coming from the price increases seen over the previous session.
Also, price action remains above the GMMA lines. The SRSI indicator lines have continued to rise into the overbought region despite the downward deflection in price movement. Therefore, this suggests that this market may proceed toward the 165.50 mark pending any contrary fundamentals.
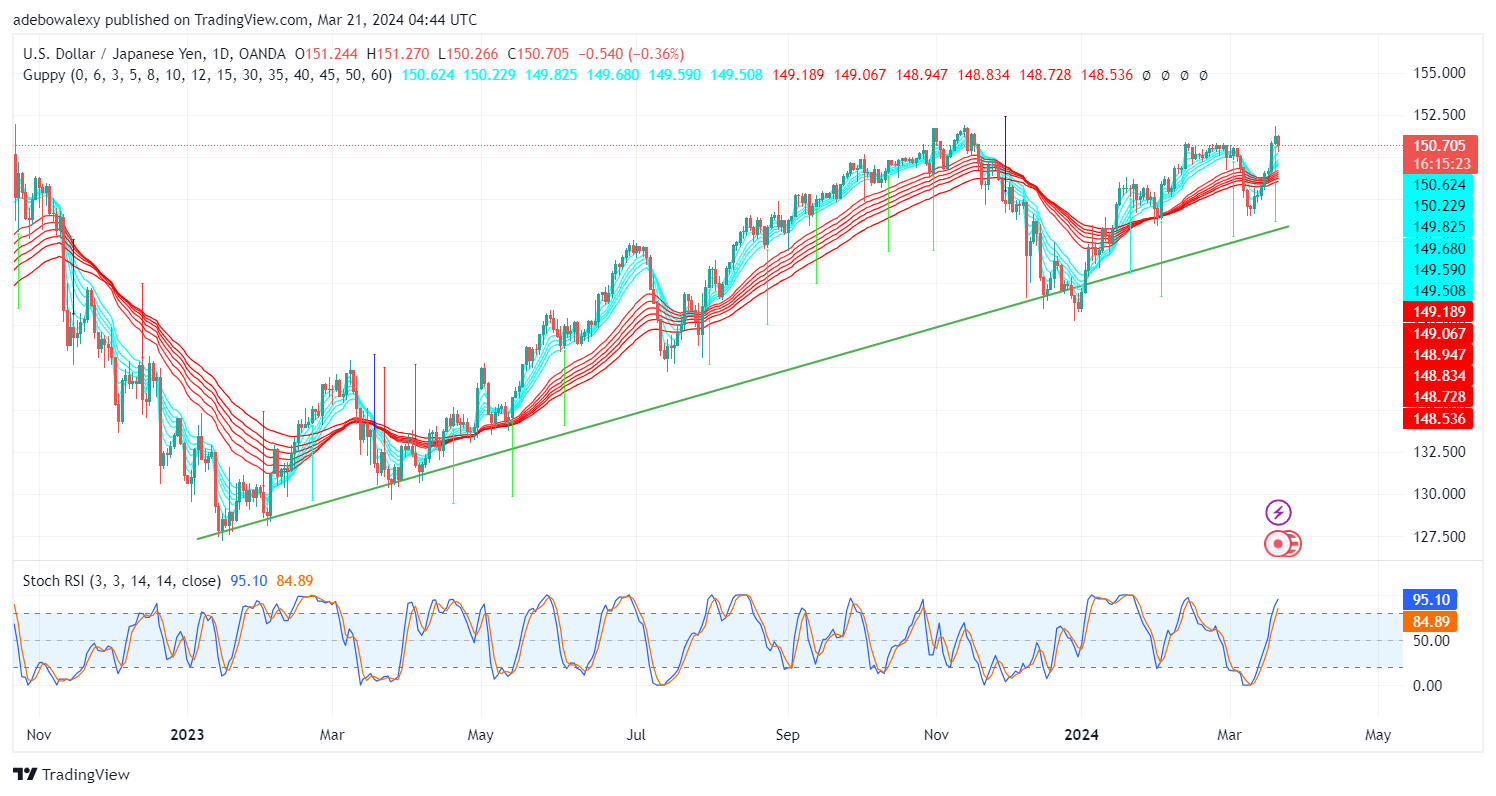
USDJPY: Bullish
The USDJPY market has continued in a slight upward trend, as revealed by the upside-sloping trendline. Also, more recently, it could be seen that the upside momentum seems to have generally intensified. However, the ongoing session has shown a mild deflection, placing the market just atop the GMMA lines.
Considering the interactions between the GMMA lines, it could be assumed that more upside momentum may be supplied by price movement. Also, despite the current price deflection, the SRSI indicator lines have continued to rise upward. This suggests that the market may progress further upward towards the 152.00 mark.
Get free access to our lifetime VIP membership. Join us here.


Leave a Reply