


The US dollar hasn’t improved much from last week. The buck continues to aid moderate upside correction in some major FX pairs. Nevertheless, as weak as the dollar is, it is still strong enough to create headwinds in some pairs. So, without further ado, let’s delve into each of these pairs one after the other.

EURUSD: Bearish
The EURUSD has struggled to print a moderate upside correction this week. However, it appears that the resistance level at the 1.09000 mark could not be breached. Market activities continue above the middle limit of the Bollinger Bands and above the Fibonacci Retracement Level 50.
Also, the Moving Average Convergence Divergence (MACD) lines are still trending upward. Consequently, this offers hope that the market will likely recover from bearish pressure and rise towards the 1.09500 mark. However, influencing fundamentals will play a key role in that.
GBPUSD: Bullish
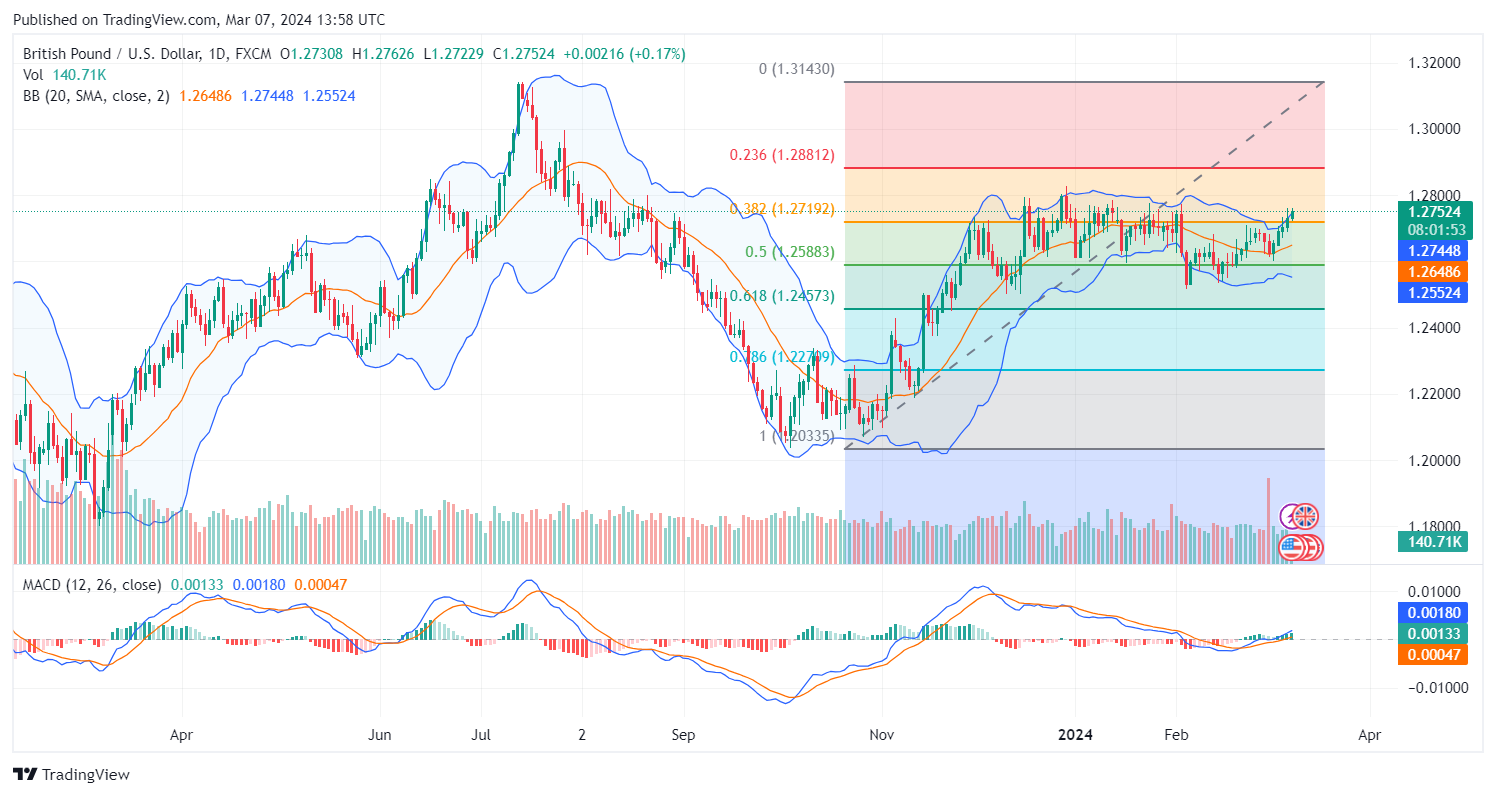
The GBPUSD has been gaining since the week started, bouncing off the middle limit of the applied Bollinger Bands in this market. As a result, the major pair has advanced through the ceiling created by level 38.20 of the Fibonacci Retracement indicator. Also, the ongoing session has obtained support above the 38.20 Fibonacci Retracement level.
Meanwhile, the MACD lines have risen past the equilibrium level and still have more upside potential, suggesting that the momentum in this market is strong enough to cause further upside corrections. Traders can anticipate that it will approach the 1.2800 mark before the end of the week.
USDCHF: Bearish
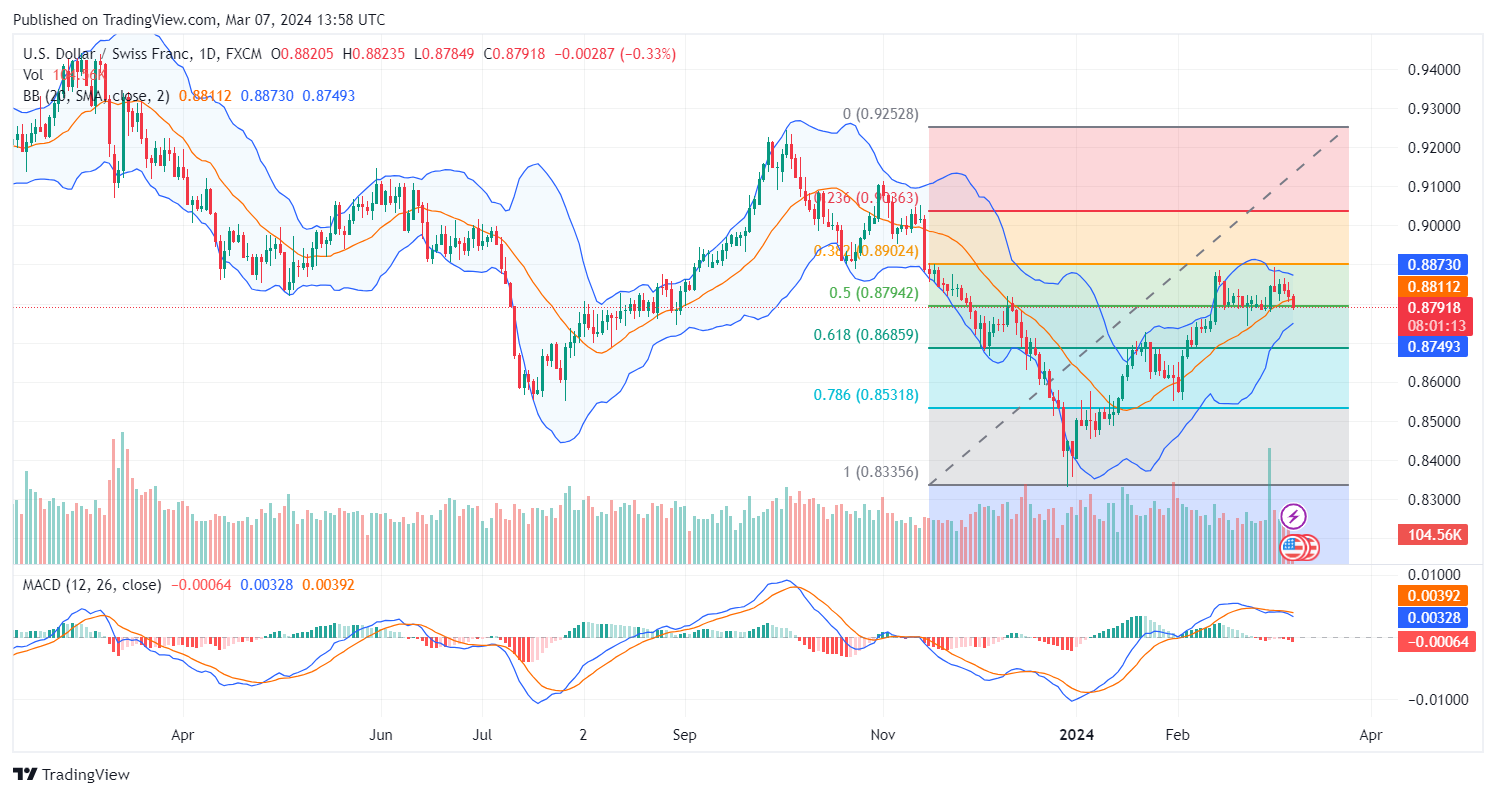
The USDCHF bulls seem to have turned tail. The market is seen on the daily chart correcting moderately downward, dipping past the 50 Fibonacci Retracement level. Headwinds seem to have increased in intensity today, considering the size of the price candle representing the ongoing session.
Consequently, the major FX pair now trades below the middle band of the Bollinger Bands indicator. In addition, the lines of the applied MACD indicator are now slightly turned toward the equilibrium level, strengthening bearish anticipation in the market. Moreover, the bars of the MACD below the centerline are all red, suggesting that bears are in control and will likely cause a downward correction toward the 0.8750 mark.
USDCAD: Bearish
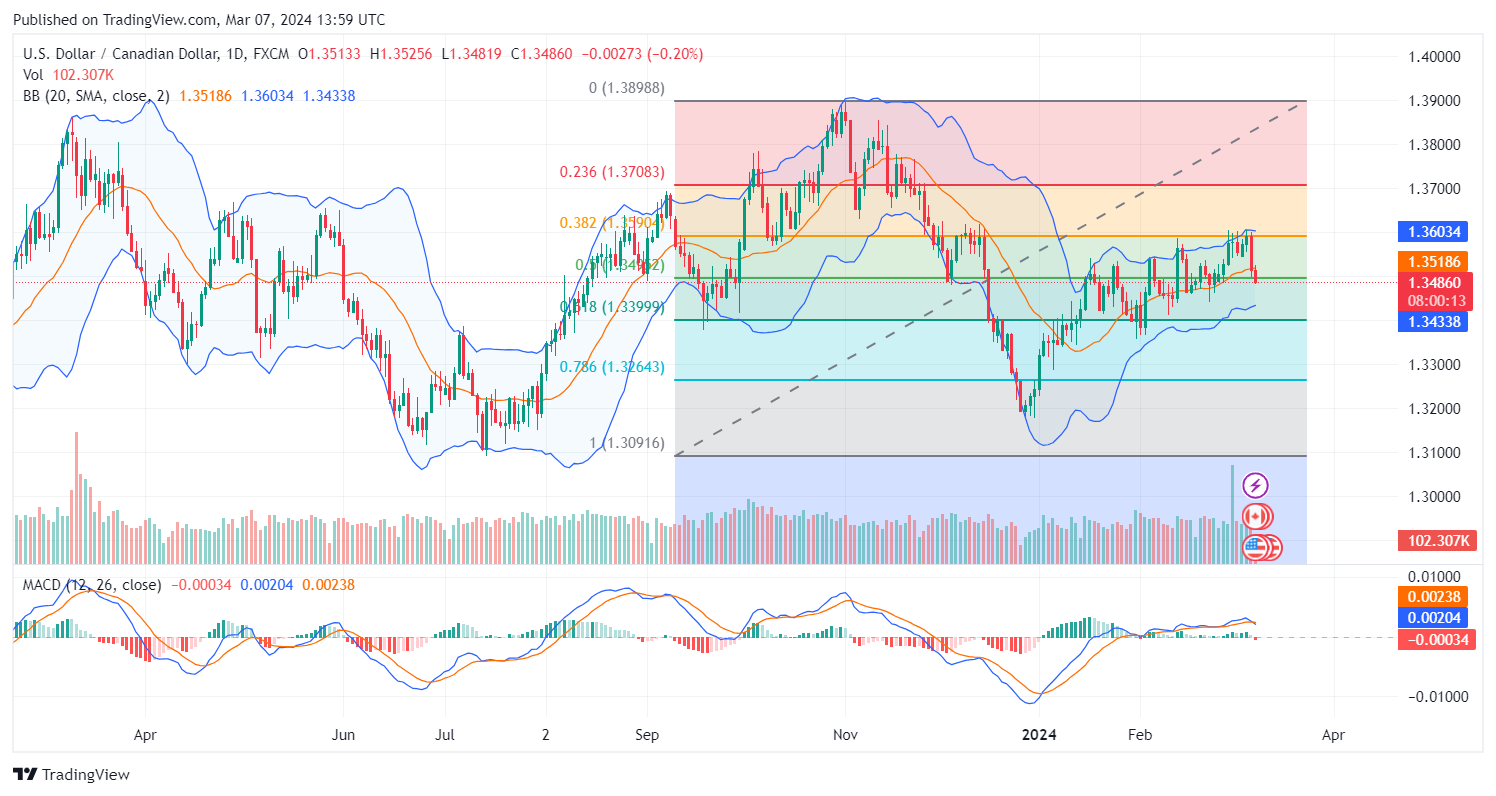
The mild depreciation of the dollar has contained the USDCAD pair within a downward trajectory. Presently, the session is trending towards the support level established by the 50 Fibonacci Retracement, positioned beneath the median line of the Bollinger Bands.
This indicates a prevailing downtrend in the market. Additionally, the Moving Average Convergence Divergence (MACD) indicator has recently undergone a bearish crossover above the centerline, with solid red bars suggesting a probable descent towards the 1.3450 threshold.
AUDUSD: Bullish
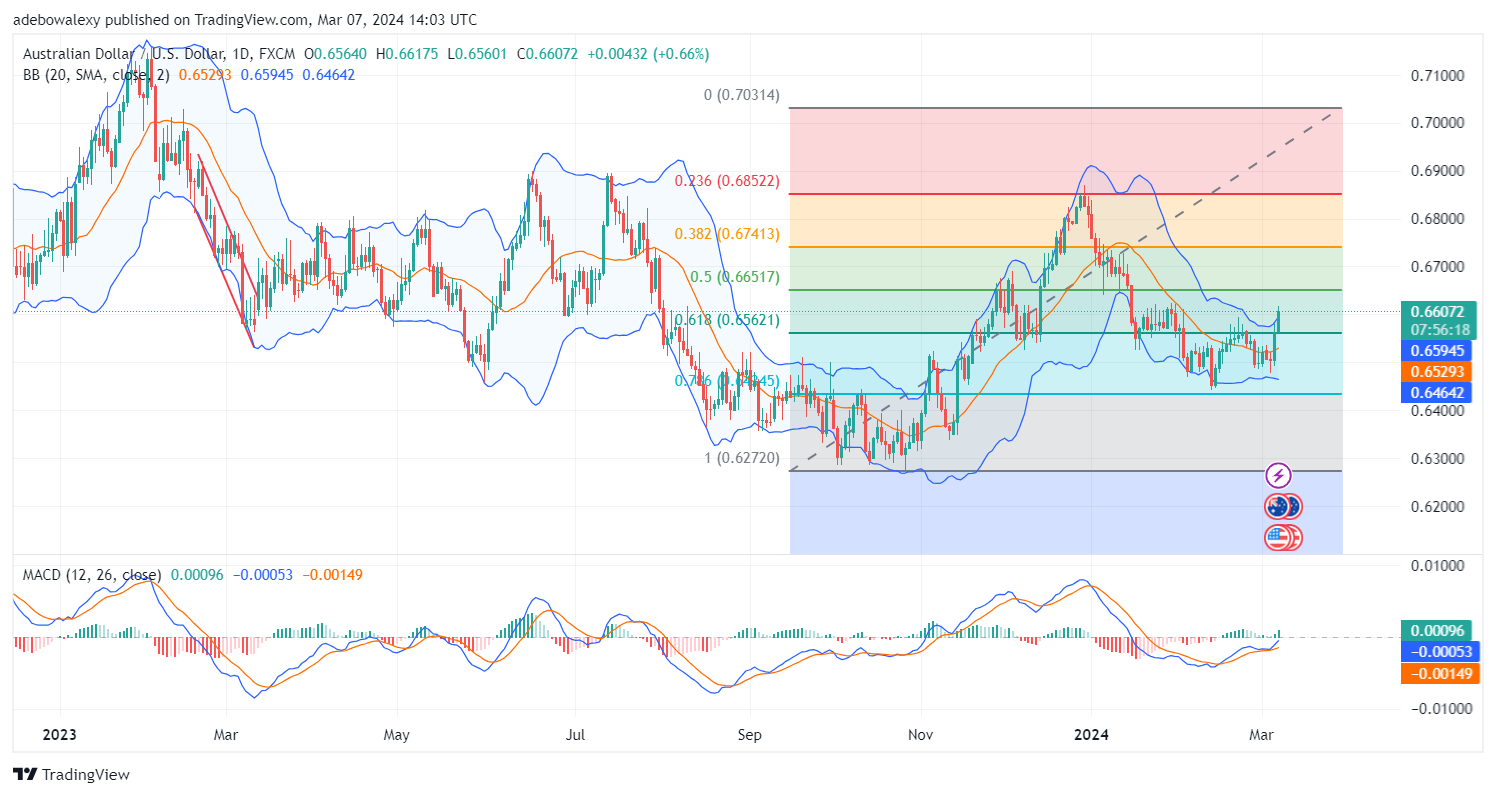
The AUDUSD is among the big winners this week, sharply correcting upwards and breaking through some key resistance levels. The last price candle here can be seen breaking through the resistance formed by the 61.80 Fibonacci Retracement level, pushing the market through the uppermost limit of the Bollinger Bands.
Although the ongoing session has a short shadow above it, it appears to be comfortably situated above the 0.6562 price level. In addition, the MACD bars are green above the equilibrium level, and the lines of this indicator continue to rise upward from below the equilibrium level. All the observed signs here suggest that the market may rise further towards the 0.6652 mark.
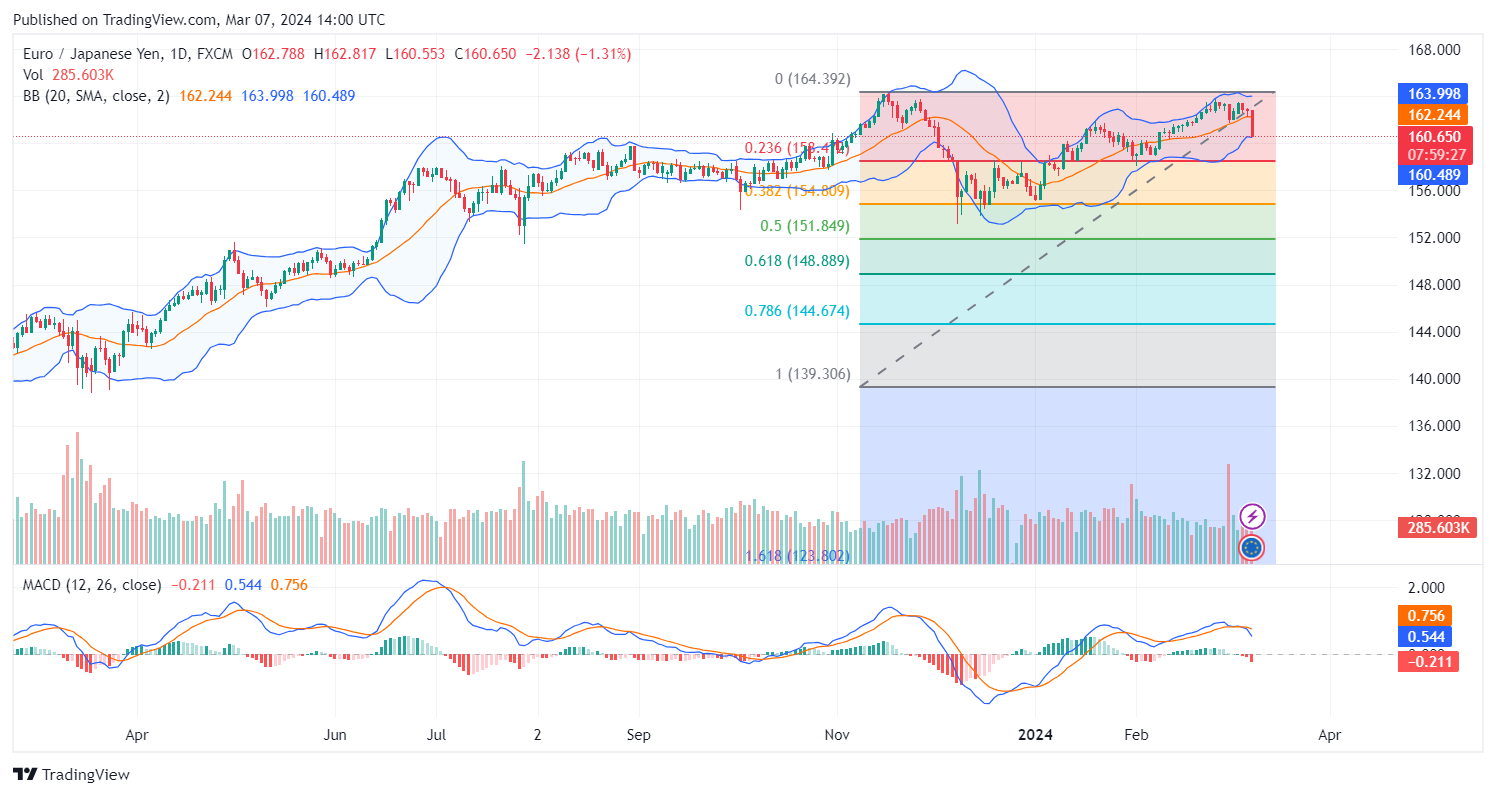
EURJPY: Bearish
While the EURJPY market has been able to maintain a steady upside path since January 2nd, today’s session has witnessed the most significant price decline in recent times. The corresponding price candle for the ongoing session plunged prices sharply downward, with the market now trading at a significant distance below the Bollinger Bands MA.
Also, the MACD lines are now pointed toward the equilibrium point, while the last bar of the MACD indicator indicates the strength of the downward momentum. The price candle representing the ongoing session has no shadow, signaling that bears are quite strong. Traders can anticipate that the market may poke through the 160.00 support level.
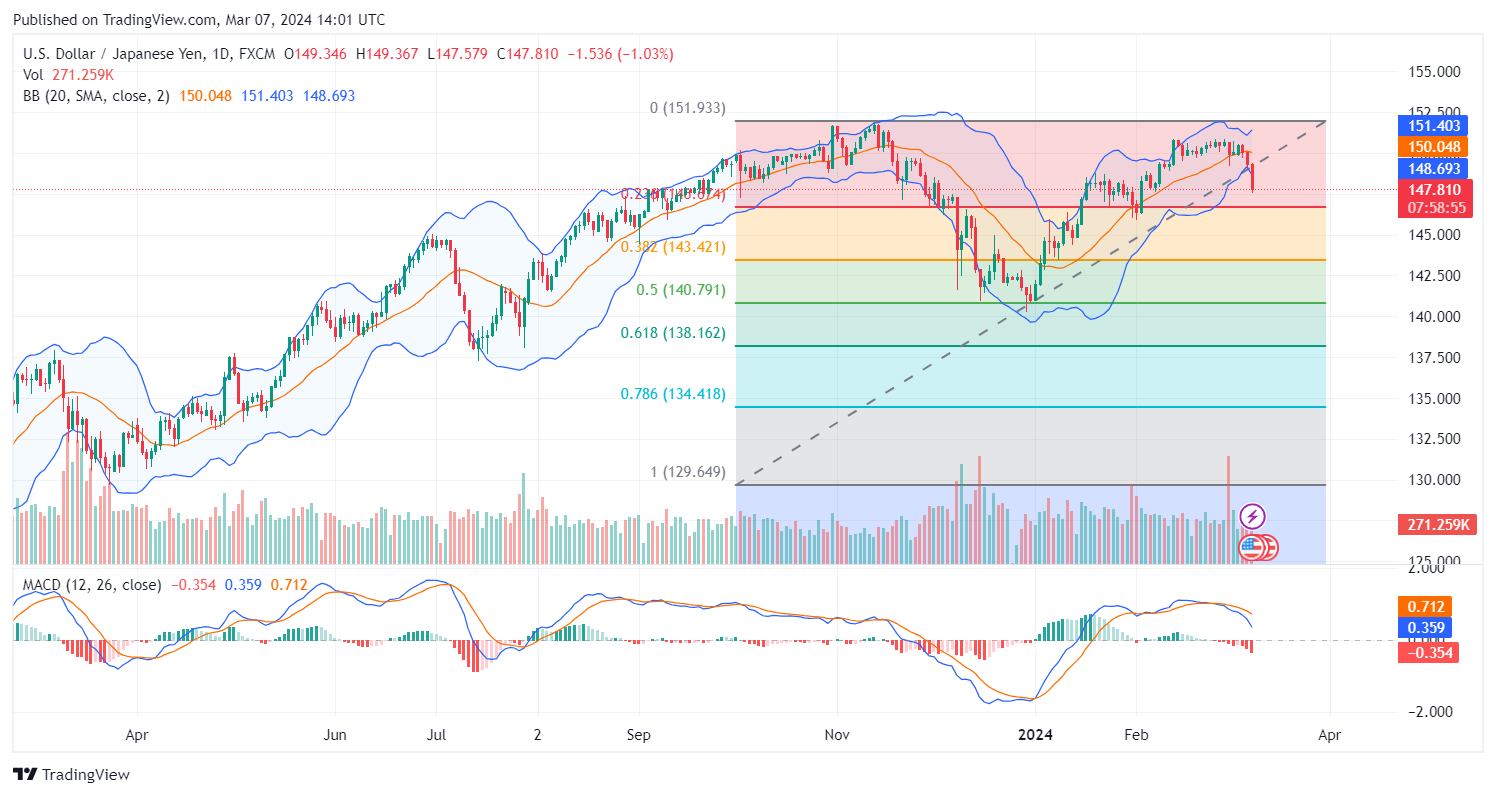
USDJPY: Bearish
The Japanese yen seems to have strengthened considerably, as the USDJPY pair has sharply fallen towards technical support at the 147.00 mark. The ongoing session has printed a strong bearish correction, with the major pair now trading below the middle limit of the Bollinger Bands.
In fact, the volatility of the market has pushed the lowest limit of the Bollinger Bands. Simultaneously, the bearish momentum in the market has significantly increased, as indicated by the last bar of the MACD indicator. The leading line of the MACD has a more divergent path, suggesting that the major FX pair will likely progress further downwards, towards the 146.50 mark.
Get free access to our lifetime VIP membership. Join us here.


Leave a Reply