


Bitcoin has once again demonstrated its resilience by regaining momentum and reclaiming the $120,000 price level, signaling renewed investor confidence. The current market consolidation reflects an intense struggle between the bulls and the bears, each side fiercely defending its position. Over the past few months, Bitcoin’s price experienced a steep correction, falling from $120,000 to as low as $109,000, sparking widespread concern among traders. However, despite the volatility and market uncertainty, the cryptocurrency managed to recover impressively. In the last two weeks, market sentiment appeared bearish, with many expecting a potential crash, but Bitcoin defied the odds by rebounding sharply. This rebound not only reaffirmed Bitcoin’s strong market fundamentals but also indicated that bullish investors remain active and determined to maintain control of the market.
Key levels
- Resistance: $123,000, $124,000, $126,000
- Support: $121,000, $120,000, $119,000
Bitcoin market data
- Market Cap: $2.42T
- Current Price: $121,600
- Circulating Supply: 19.93M BTC
- Total Supply: 19.93M BTC
- Ranking: #1
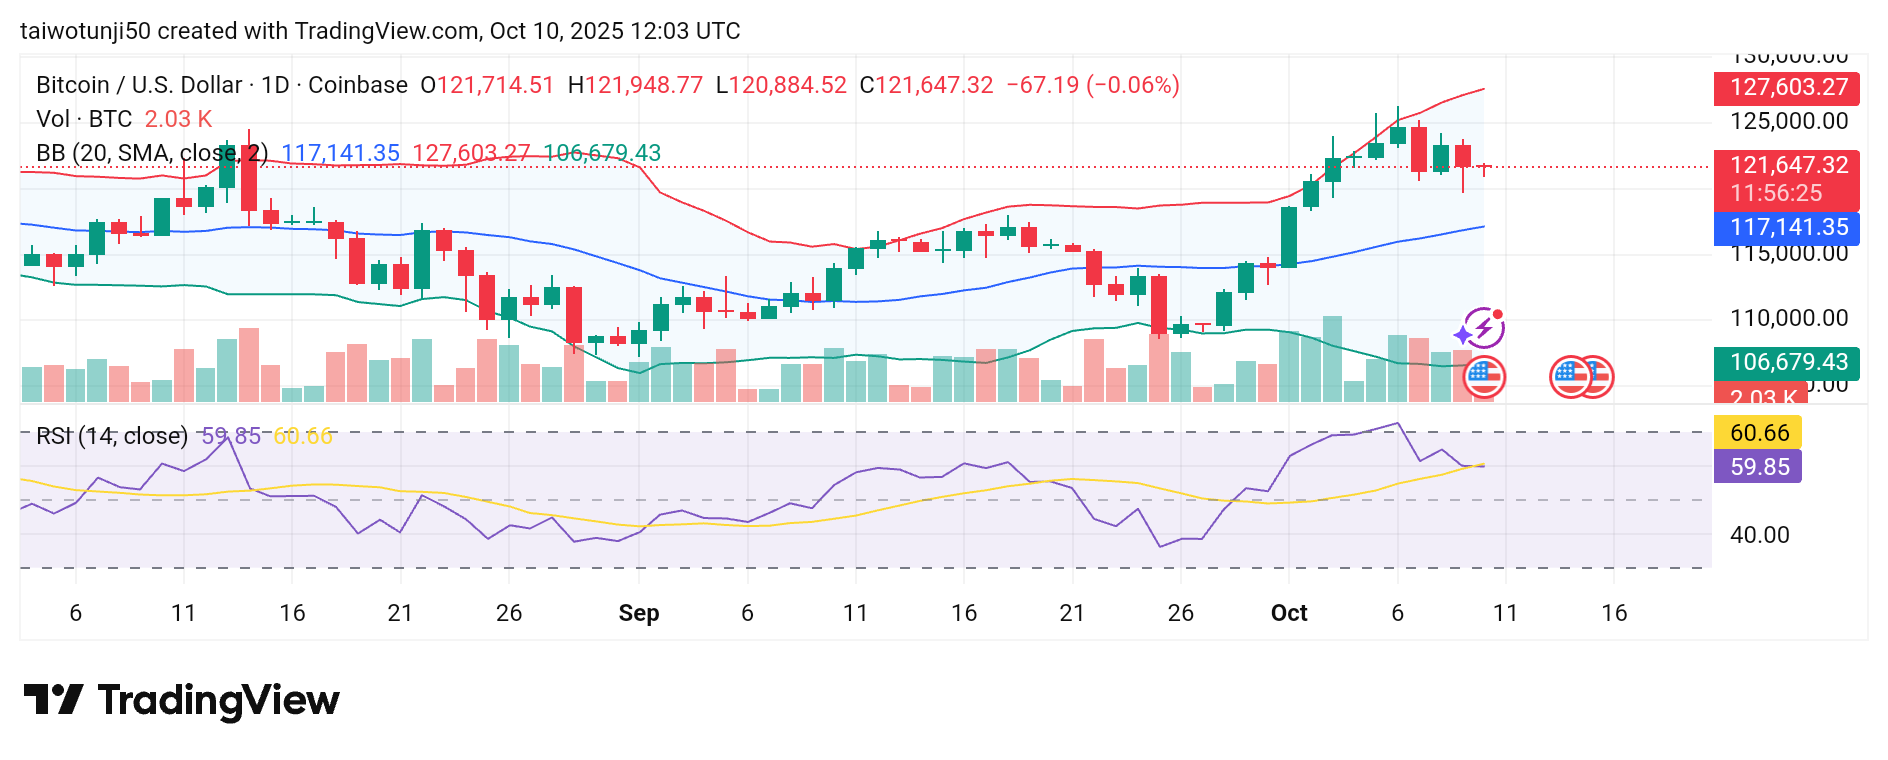
Bitcoin Daily Chart
The Bitcoin daily chart has recently displayed a sustained upward trend, reflecting growing bullish momentum in the market. However, at present, the bears appear to have a temporary grip, as shown by the current red candlestick. Despite this, the overall structure still favors the bulls, with price action remaining resilient around the $121,600 mark. The presence of a long lower shadow on the candlestick suggests that buyers are actively defending this level, preventing further decline and hinting at potential upward pressure. Moreover, Bitcoin’s price remains positioned above the middle Bollinger Band — a sign that the broader trend is still bullish. Supporting this outlook, the Relative Strength Index (RSI) has shown mixed signals; while a recent crossover indicated short-term weakness, the divergence of the lines now suggests that momentum could be shifting back toward buyers. Altogether, these indicators point to a likely price rebound, signaling that the bulls may soon reclaim dominance in the daily chart.
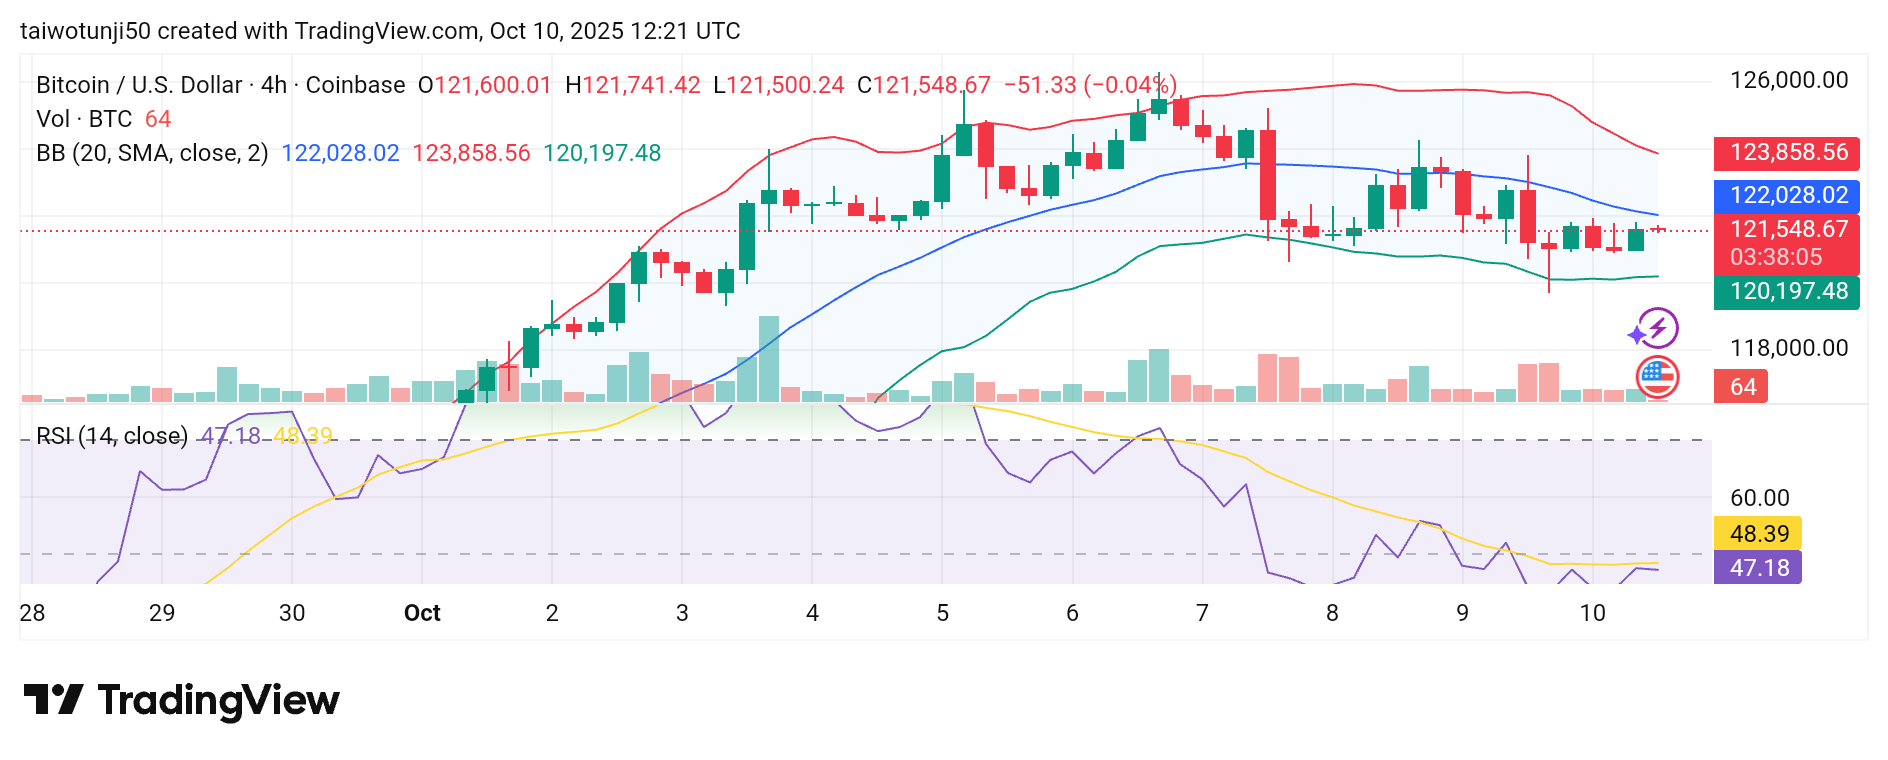
Bitcoin 4-hour Chart
The Bitcoin 4-hour chart reveals that bearish sentiment currently dominates the market, with sellers firmly holding control. The bears have successfully capped the price below the $121,600 resistance level, consistently rejecting any upward attempts from buyers. This persistent resistance suggests a strong selling zone that the bulls must overcome to regain momentum. Furthermore, the price has slipped below the middle Bollinger Band, indicating a weakening short-term trend and a possible continuation of bearish pressure. The Relative Strength Index (RSI) lines, meanwhile, are moving horizontally without signs of an imminent crossover — a reflection of market indecision and consolidation under bearish control. Taken together, these signals imply that the bears may continue to dictate short-term movement, although a rebound in favor of the bulls could emerge once selling momentum begins to fade and technical indicators start to realign upward.
Get access to lifetime VIP membership. Join us here.


Leave a Reply